



Consumer sentiment is context. Your own downstream data is the decision signal. When U.S. consumers become more cautious, dental practice owners should watch the signals that show whether that caution is actually reaching their patient acquisition funnel.
Below, we are going to walk you through those signals, from first inquiry to booked patient.
Why national sentiment can’t show you your own funnel

One detail in the latest consumer data is worth noting. The University of Michigan researchers note that consumers who plan to cut back on groceries are likely substituting, such as trading down from name brands to generics, rather than cutting total food spending.
That is a general consumer finding, not a dental one, but it shows why a headline can mislead. “Cutting back” can mean buying less, buying differently, or buying later. Only your funnel data shows which, if any, is happening at your practice.
Not every practice can track every metric below; start with what you can measure reliably.
Top of the funnel: lead volume, cost per lead, and lead quality

- Lead volume. Calls and form submissions by campaign and service. Compare against the same months in prior years to account for seasonality.
- Cost per lead. Useful but incomplete. A rising cost per lead may reflect auction competition rather than patient demand.
- Lead quality. Whether inquiries come from real prospective patients, in your area, asking about services you offer.
Middle of the funnel: calls, response time, and lead-to-booking rate

- Call quality. Where recordings exist, listen for more questions about price, insurance, or payment options. Make sure any call recording follows state consent laws and your HIPAA obligations.
- Response time. How quickly forms and missed calls are followed up. Slower follow-up can look like weaker demand when it is actually an operational issue.
- Lead-to-booking rate. The share of leads that become appointments. This can be one of the first places hesitation shows up, because a patient may still inquire but take longer to commit.
Bottom of the funnel: booked patients, service mix, and downstream conversion

- Booked patients, when trackable. The closest measure of what advertising produces for the practice. Paired with spend, it gives cost per booked patient.
- Service mix. Whether inquiries and appointments are shifting between services, such as from elective treatment toward routine care. Patients may adjust this way without stopping altogether.
- Downstream conversion. Case acceptance and time from consultation to treatment, where the practice records them.
- Cancellations and no-shows. Worth reviewing only if tracked consistently enough to provide a baseline.
How to read your patient acquisition signals together
Patterns across the funnel say more than any single metric. Here is how Northwind reads some common combinations:
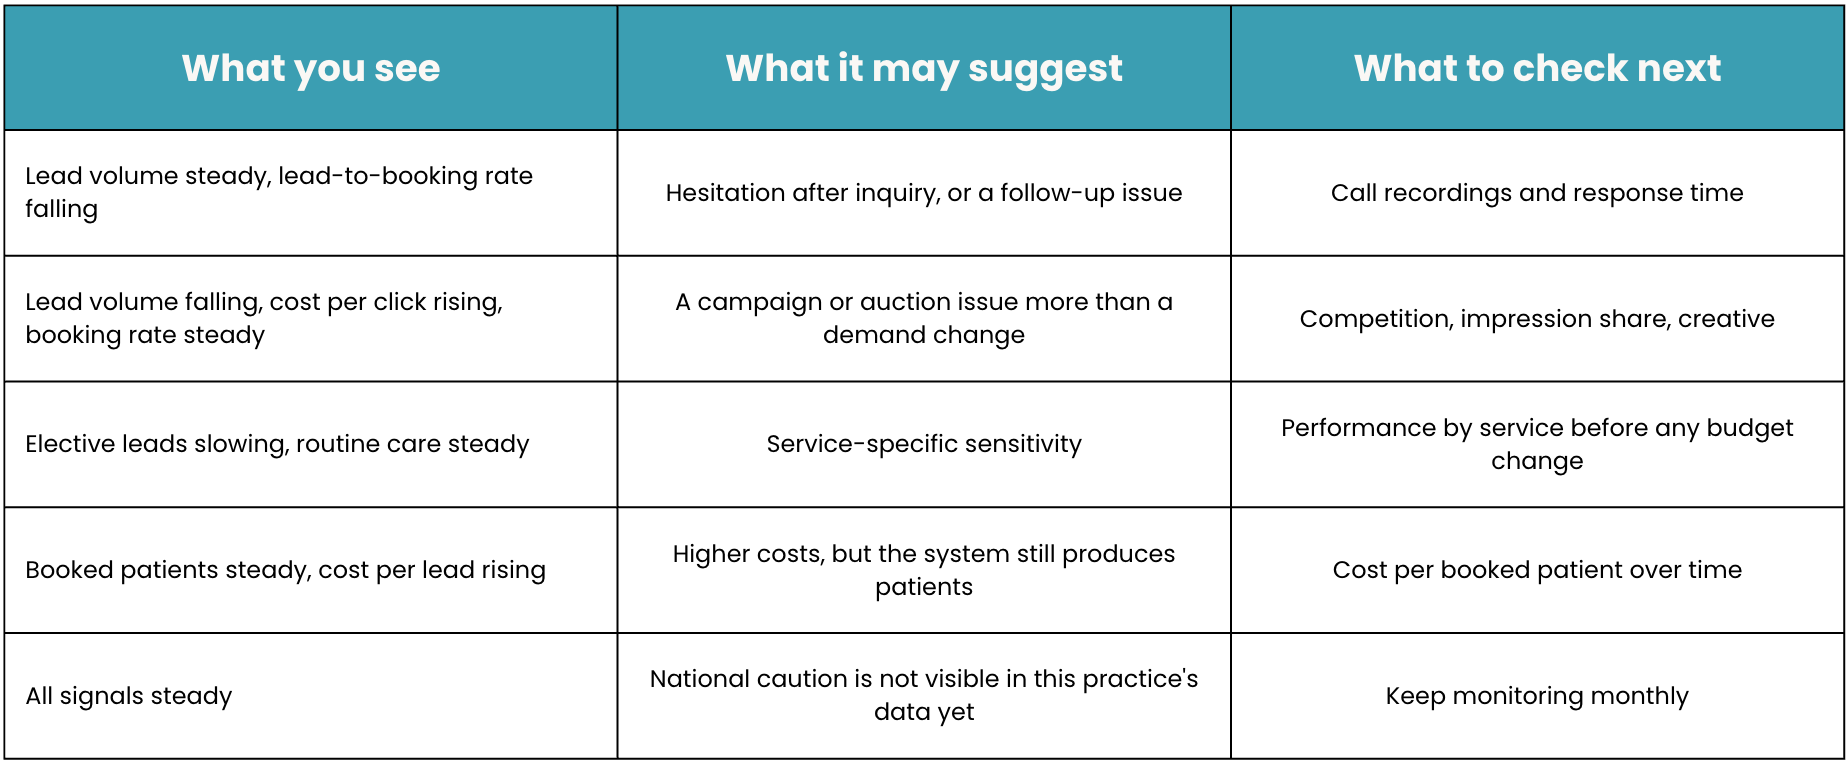
These are possibilities to investigate, not diagnoses. The same pattern can have different causes in different practices.
The takeaway: measure before you react
When consumers become more cautious, dental practice owners don’t need to guess. A few reliable signals, read together over time, show whether that caution is reaching the practice, and where.
Related: What Current U.S. Consumer Sentiment Tells Dental Practice Owners
Sources
-
University of Michigan Surveys of Consumers, Gasoline Prices and Expected Consumer Spending, October 9, 2026.
https://www.sca.isr.umich.edu/files/consumptionresponse202610.pdf